BCR Repertoire Sequencing: Error Correction
Sequencing errors: where do they come from?
Immune repertoire sequencing (Rep-seq) allows us to deconvolute the population of antibody sequences that comprise an individual’s B-cell response. While antibody repertoire diversity is known to be vast, errors can cause a false measurement of diversity suggesting a more diverse sample than is actually present. Errors obscure true variants and provide for invalid conclusions about the underlying sample. Errors originate primarily from two sources: 1) errors from PCR amplification steps and 2) errors originating from the sequencing itself. In this blog post, we will only consider the effect of sequencing induced errors rather than those of PCR induced errors.
Antibody repertoire sequencing relies primarily on the Illumina MiSeq sequencer due to the relatively low error rate, high throughput (~30M reads per run), and sufficiently long reads to cover the variable region of antibodies (two overlapping reads of 300nt each). However, despite these desirable qualities, the average base error rate of the MiSeq is 1% (1), primarily in the form of substitution errors, which means that there will be an expected 3-4 errors over the typical ~360nt variable region of the antibody. While this is a simplification of the MiSeq error rate (e.g., positional dependence, etc), it is a useful simplification.

Knowing that errors are likely to occur in each read, different approaches have been used to process reads in the literature:
- Do nothing. Use all reads assuming errors are minor, collapsing unique reads.
- Collapse unique reads and retain all above a global threshold, e.g., min abundance of 2.
- Perform clustering based error correction (Our approach, explained in more detail below)
While approach #1 and #2 seem similar, #2 can be interpreted as the simplest form of error correction: sequences observed independently multiple times are unlikely to have random errors occurring at the same positions and are thus likely correct. Unfortunately, method #2 retains only a small fraction of reads, thus is very wasteful, while method #1 ignores a very real problem for characterizing true diversity and not sequencing artifacts.
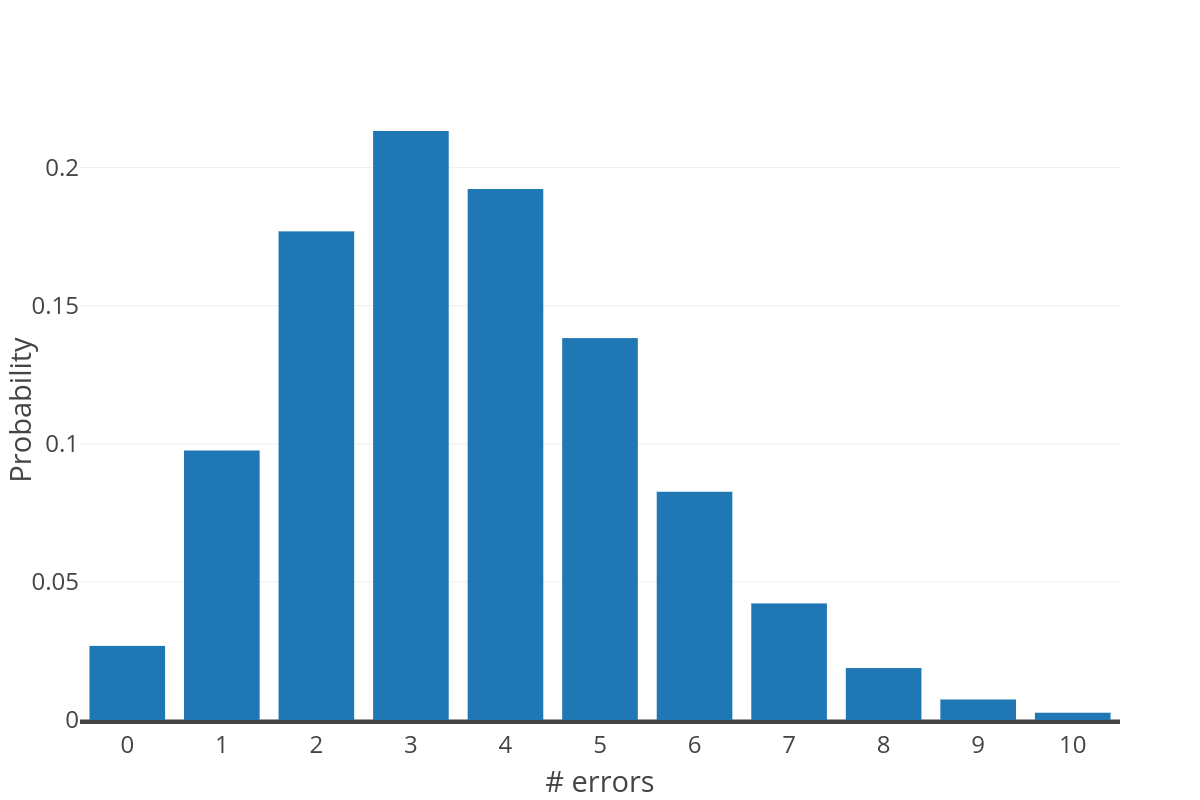
The figure to the right shows the expected distribution of errors over a sequence of 360nt at a probability of 0.01 (computed as a binomial distribution). This distribution further exemplifies why approach #1 is not reasonable; as only a small number of reads are expected to be error free.
Tell Us About Your Project.
Need more information? We're here to answer any questions you have.
Effect of errors on antibody repertoire sequencing
Common approaches to handling errors
To show the effect sequencing errors have on the diversity of the compiled repertoire, we simulated a repertoire (i.e., simulated V, D, and J recombination and somatic hypermutation events) to obtain a ground truth dataset. This repertoire, simulated with uniform V, D, J gene usage and 10+/-4nt mutations per sequence, was then subjected to simulated read sequencing using the ART read simulator (2). From 10,000 unique recombined repertoire sequences, we simulated a uniform depth of 10 each, resulting in 100,000 simulated paired-end reads with the Illumina MiSeq error profile. These reads were then processed using our Reptor™ pipeline.
Briefly, Reptor™ performs error correction using a Hamming graph to cluster similar reads (3). Every unique read is a node in the Hamming graph HG=(V,E), and an edge is drawn between two nodes u,v in V if and only if HammingDist(u,v) <= tau. The tau parameter then controls how connected HG becomes. Once a graph is constructed, dense subgraphs are identified and used to partition the reads. The consensus sequence is then taken on all reads within a partition to remove errors.

If we consider the three approaches described above, we will obtain:
- 68,639 unique reads.
- 8,235 unique reads with min abundance 2 (only 12% of the total input reads).
- 9,105 unique clusters (consensus reads) with min abundance 2 (8,522 at the correct abundance of 10).
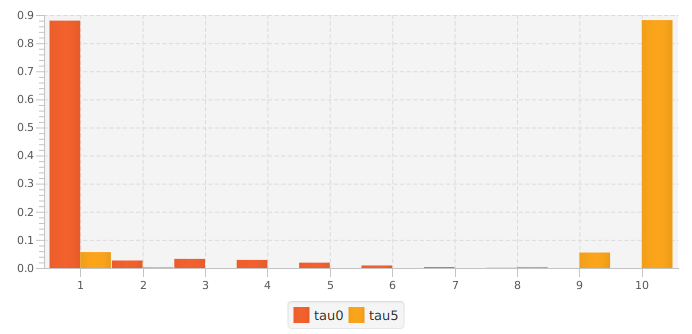
The figure to the left shows the distribution of counts for two of the methods (#1 and #3). Doing nothing retains all reads, but nearly all are (incorrectly) singletons. Performing a min abundance cutoff reduces the number of errors, but throws out 88% of the reads. Method #3 (using parameter tau=5) retains 94% of the total reads, with 88.4% at the correct abundance (abundance of 10).
Clustering fidelity
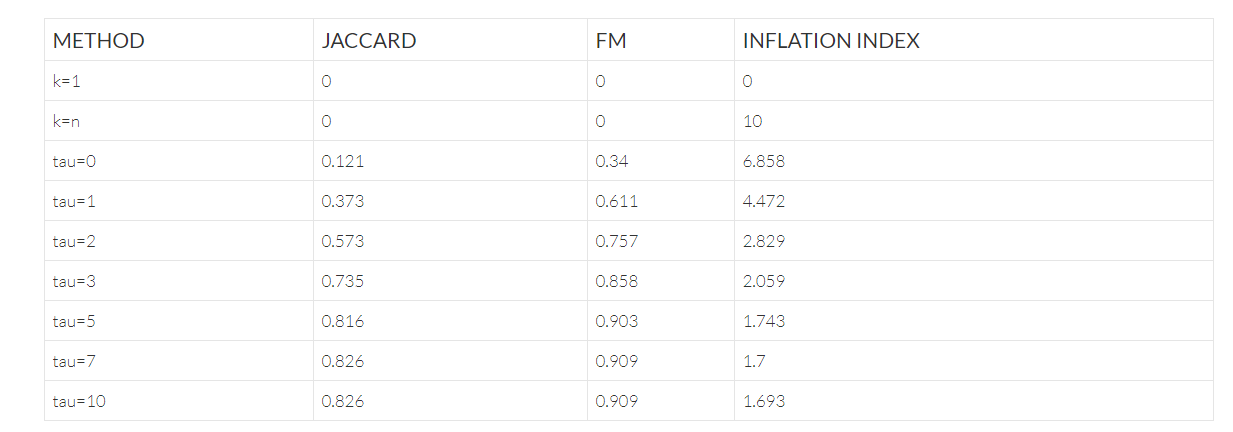
One method to understand how clustering reads on similarity can improve errors is by measuring the quality of the partitioning of reads compared to the true partition. These can be measured using Jaccard similarity, and Fowlkes-Mallows index (FM); where a value of 0.0 represents a disjoint partitioning and 1.0 represents an exact partitioning. Additionally, we can also measure the extraneous, erroneous diversity by the inflation index; defined as the ratio of observed to expected unique sequences, where a ratio of 1.0 is a perfect representation, and a value > 1.0 represents inflated diversity.
The table below shows the effect of the parameter tau on the Reptor™ Hamming graph approach, where tau=0 corresponds to collapsing unique reads only (i.e., approach #1 from the previous section). This shows that from tau=5 onward, the partitions do not change; suggesting that effectively few additional reads are clustered together and no additional gains are realized. It also shows that on this uniform dataset, over-correction does not appear to occur.

The table above includes two dummy rows of k=n (i.e., clustering all reads in their own cluster), and k=1 (i.e., clustering all reads in a single cluster) to show the effects of the statistics in these edge cases.
Other approaches to error correction
This blog post highlighted the importance of handling sequencing errors for immune repertoires, ignoring them is not a viable option. While Reptor takes a purely algorithmic approach to error correction, another common approach is to incorporate unique molecular identifiers (UMIs) into the library creation process. UMIs require attaching a short, uniquely identifying oligonucleotide stretch to each molecule during the library preparation. Then, clustering can be performed on this UMI, grouping together only reads from the same molecule, and then taking the consensus to remove errors. This approach is attractive but has downsides as well.
UMIs must be generated uniformly randomly to reduce the possibility of collisions. Synthesizing long stretches of random nucleotides from a uniform distribution can be difficult, and sometimes spacers need to be incorporated, increasing the amplicon size. Furthermore, dimerization between two distinct UMIs can create chimera products that are difficult to detect. Finally, PCR and sequencing errors can accumulate in the UMI which then may require clustering on the UMI sequence (with a Hamming graph maybe?) to prevent loss of sequences (4). A full comparison between the Hamming graph error correction approach and UMIs is beyond the scope of this blog post, but certainly, either approach is preferable to ignoring artifactual diversity in repertoires.
References
(1) Melanie Schirmer, Rosalinda DAmore, Umer Z Ijaz, Neil Hall, and Christopher Quince. Illumina error profiles: resolving fine-scale variation in metagenomic sequencing data. BMC bioinformatics, 17(1):125, 2016.(PubMed: 26968756)
(2) Weichun Huang, Leping Li, Jason R Myers, and Gabor T Marth. ART: a next-generation sequencing read simulator. Bioinformatics, 28(4):593–594, 2011. (PubMed: 22199392)
(3) Y. Safonova, S. Bonissone, E. Kurpilyansky, E. Starostina, A. Lapidus, J. Stinson, L. DePalatis, W. Sandoval, J. Lill, and P. A. Pevzner. IgRepertoireConstructor: a novel algorithm for antibody repertoire construction and immunoproteogenomics analysis. Bioinformatics, 31(12):53–61, Jun 2015 (PubMed: 26072509)
(4) Smith, Tom, Andreas Heger, and Ian Sudbery. “UMI-tools: modeling sequencing errors in Unique Molecular Identifiers to improve quantification accuracy.” Genome research 27.3 (2017): 491-499. (PubMed: 28100584)
We discussed the overall antibody repertoire sequencing process in a previous blog post. Sample preparation, and RNA quality in particular, are critical for accurate antibody repertoire sequencing, which we discussed in yet another blog post.