Case Study: Reptor Biological vs Technical Replicates
Project Summary
Next-generation sequencing of B cell populations (Rep-Seq) has become a powerful tool in immunology and antibody discovery. At Abterra Bio we developed Reptor, an integrated Rep-Seq sequencing and analysis service. A key goal of Reptor is to provide our customers access to every relevant antibody sequence in the sample, as well as provide key insights to move their research forward. To ensure adequate sampling of a repertoire, we include a rarefaction curve as part of our standard deliverables. The rarefaction curve shows the contribution (in terms of new clones) of additional sequencing reads. If the library is sufficiently sequenced, we see a plateau in the curve.
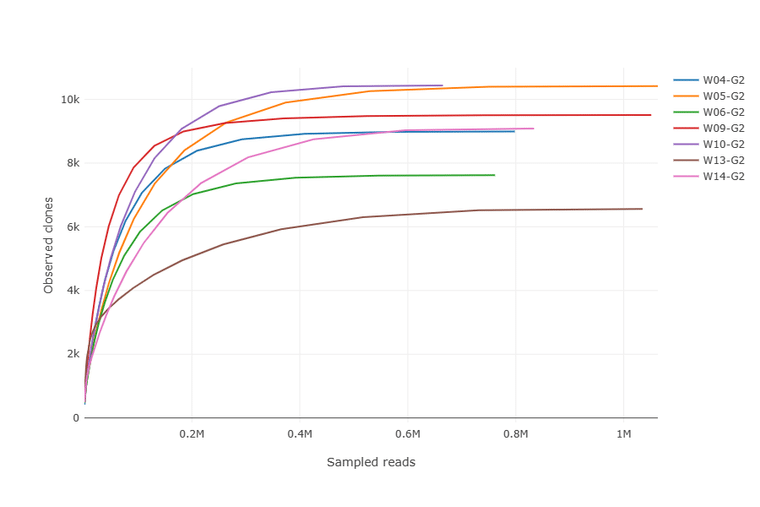
The Alpha Diversity plot above shows that no new clones will likely be observed with additional sequencing for the 7 libraries analyzed. In this plot, clones are defined by unique amino acid CDR3 sequences.
The Alpha Diversity plot ensures that the library is sequenced to a sufficient depth. However, a prepared library can be sequenced sufficiently and yet the repertoire of sequences from the starting sample is not completely captured. Variation created by subsampling at various Reptor stages, as well as PCR and sequencing biases, can lead to incomplete sampling.
In this blog post we will evaluate the utility of biological and technical replicates to achieve two common goals of Rep-Seq projects across several input types:
Objective 1
Identify all clones in a sample (Total Diversity)
Objective 2
Identify the most abundant clones in a sample (Top Clones)
Definitions:
-
Clone: We define a clone by unique CDR3 amino acid sequence. A clone may consist of multiple nucleic acid sequences that translate to the same CDR3.
-
Biological replicate: A distinct sampling of cells from the same individual at the same time (e.g. diffferent tubes of cells from the same blood draw).
-
Technical replicate: A sampling taken after RNA extraction, cDNA synthesis, or transcriptome wide cDNA amplification, but before gene-specific PCR.
We will investigate the value of replicates in three scenarios:
Scenario 1: High diversity PBMCs from 18 naive llamas
Project description: PBMCs from 18 non-vaccinated llamas were collected and analyzed by Reptor. For each animal, we lysed 1 vial of PBMCs containing between 1-5 x 10^7 cells for RNA isolation. Total RNA was aliquoted into two technical replicates for cDNA synthesis. The 36 aliquots were then sequenced and analyzed independently by Reptor. Only the heavy chain-only isotypes (IgG2b and IgG2c) were analyzed.
Comparing Total Clones Across Replicates
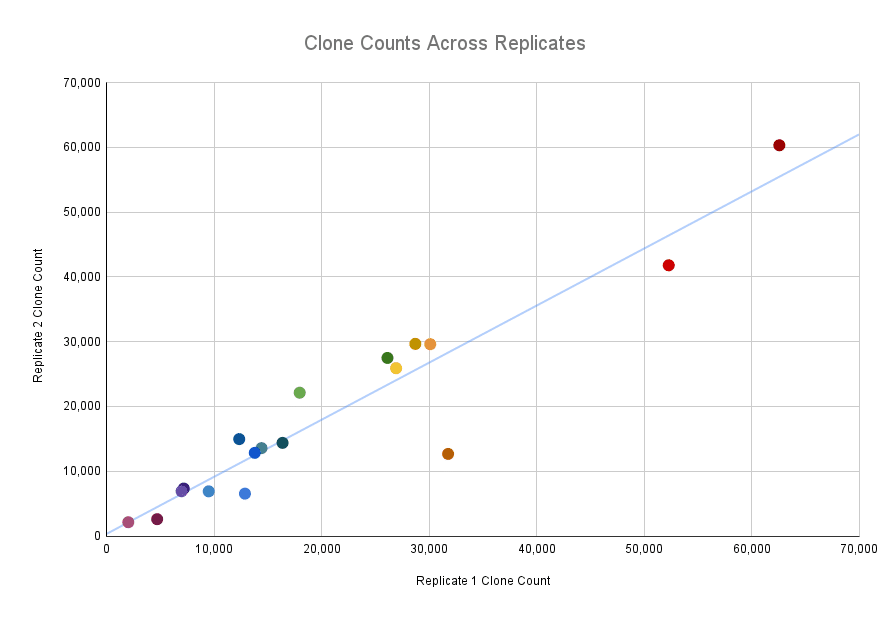
Concordance of number of clones was very high across replicates (Pearson correlation of 0.944). Each point shows the clone counts across replicates for 1 llama.
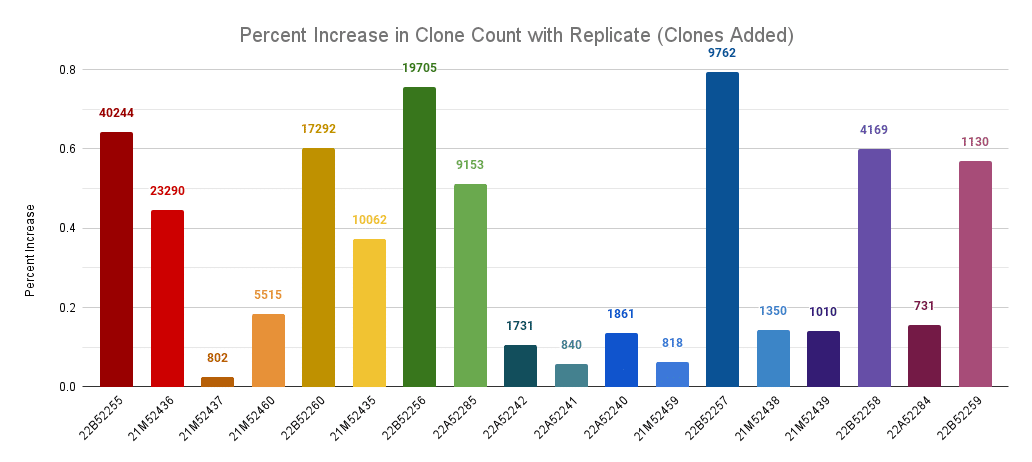
Percentage increase in clone count by adding a replicate across llamas. The labels are the number of new clones discovered in the replicate.
Comparing the top 25% of clones (by read count) across replicates
A common measure of similarity of two sets is the Jaccard Index or Jaccard Similarity, which is calculated by dividing the size of the intersection by the size of the union of the two sets. It ranges from 0 to 1, with 0 indicating no overlap between the sets and 1 indicating the sets are identical.
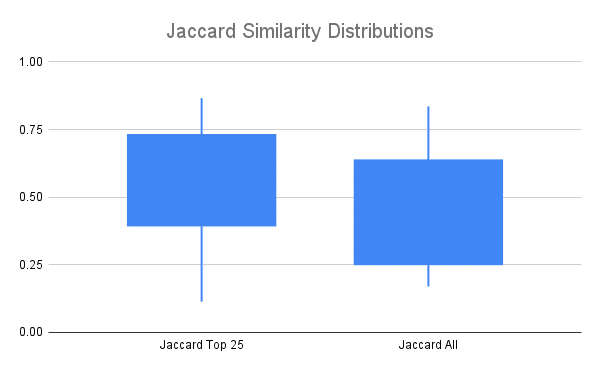
Jaccard Similarity of clones identified in replicates looking at only the top 25% of clones by read count (Jaccard Top 25), or all clones.
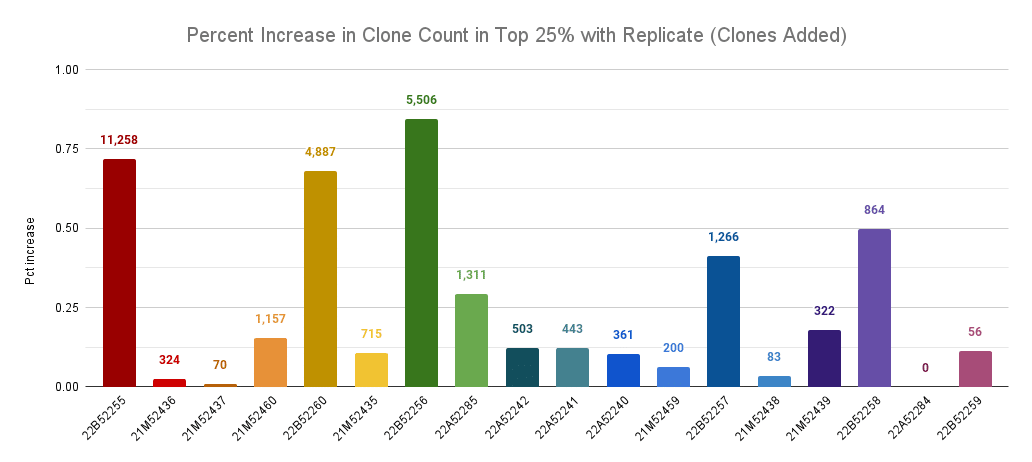
Percentage increase in clone count by adding a replicate across llamas, comparing only the top 25% of clones by read count. The labels are the number of new clones discovered in the top 25 clones of the replicate.
Take home message:
-
Technical replicates consistently measured the diversity of the underlying sample as shown by strong concordance of clone counts across replicates. However, a single replicate added on average 35% more clones (8,303 CDR3s).
-
Jaccard similarity of the top 25% of clones was higher most of the time than the Jaccard similarity of all clones. Even among the top 25% of clones, on average 25% more clones (1,629 CDR3s) could be found in a replicate.
Scenario 2: High diversity PBMCs from a ‘naive’ human
Project description: PBMCs from a healthy donor were collected and analyzed by Reptor. Two vials of ~1 x 10^6 cells were analyzed. For each vial, RNA was aliquoted into two technical replicates (4 libraries total). The 4 aliquots were then sequenced and analyzed independently by Reptor. Only the heavy chain was sequenced, however, all isotypes were considered (IgG, IgM, IgA, IgE, IgD).
Repertoire Wide Statistics
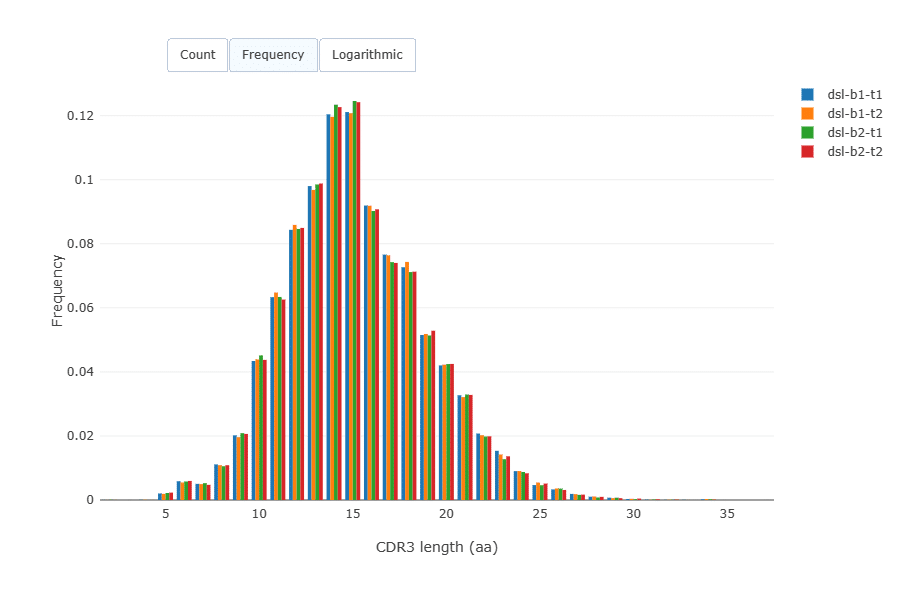
CDR3 length distribution was virtually identical across the samples.
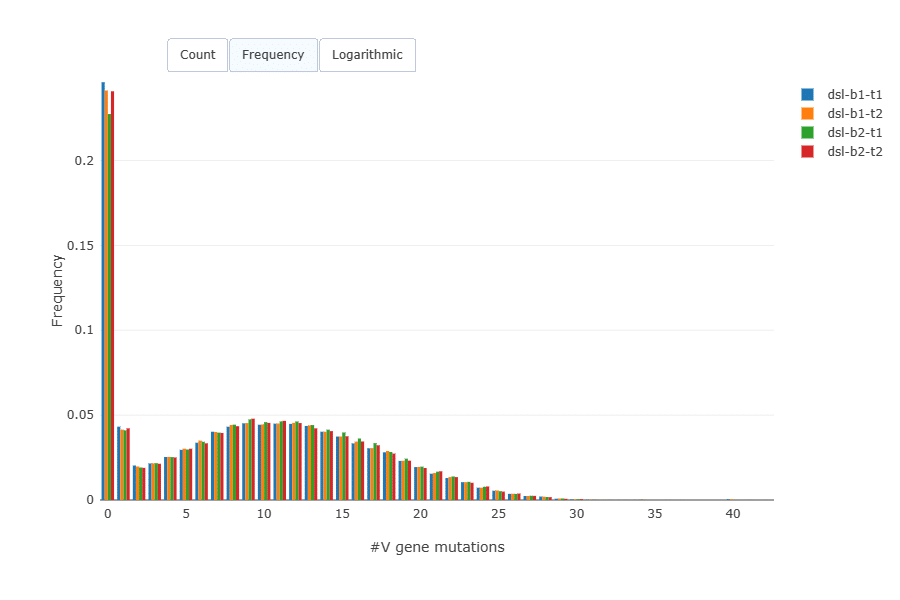
Mutation load (amino acid mutations per sequence) was very similar across the replicates. A majority of B cells in blood are naive B cells and have no mutations.
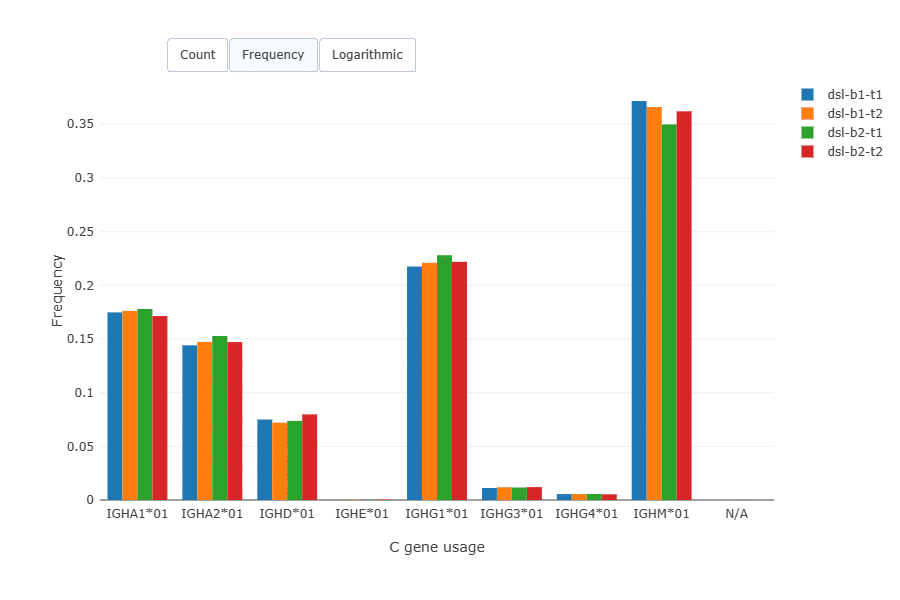
Isotype distribution across the replicates was very similar.
The number of clones found in each replicate was fairly consistent across technical replicates but varied across biological replicates.
Technical Replicates – comparing Technical Replicate 1 (Rep1) and Technical Replicate 2 (Rep2) from Biological Replicate 1.
Total Diversity
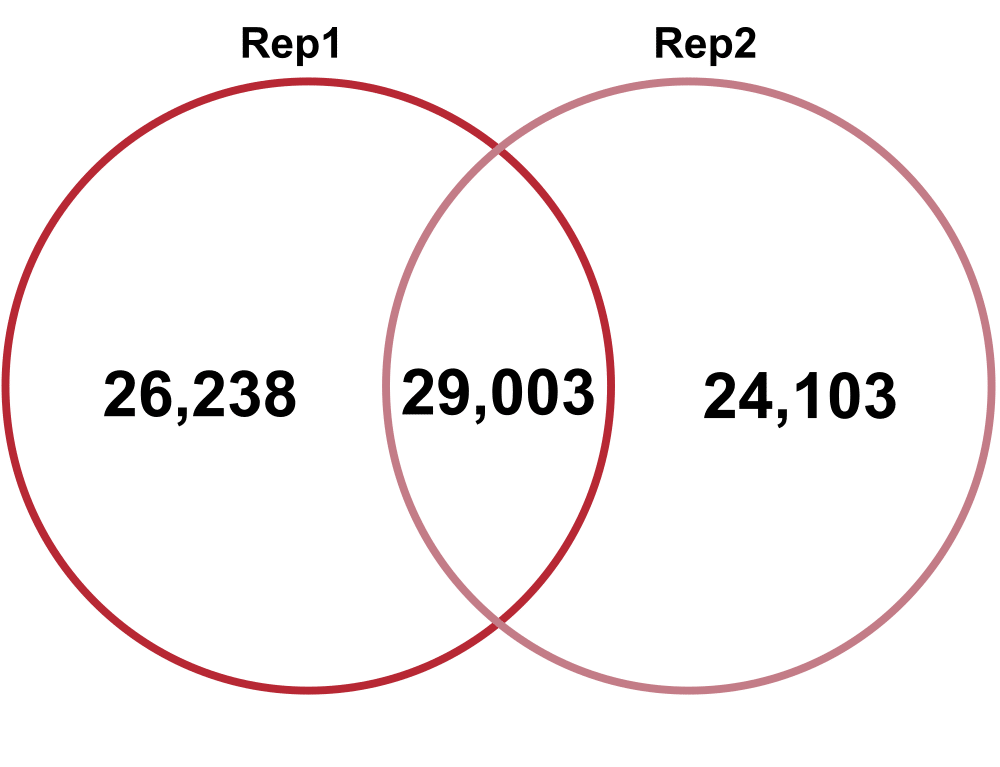
Jaccard: 0.24
Percent increase in clones: 59%
Top Clones
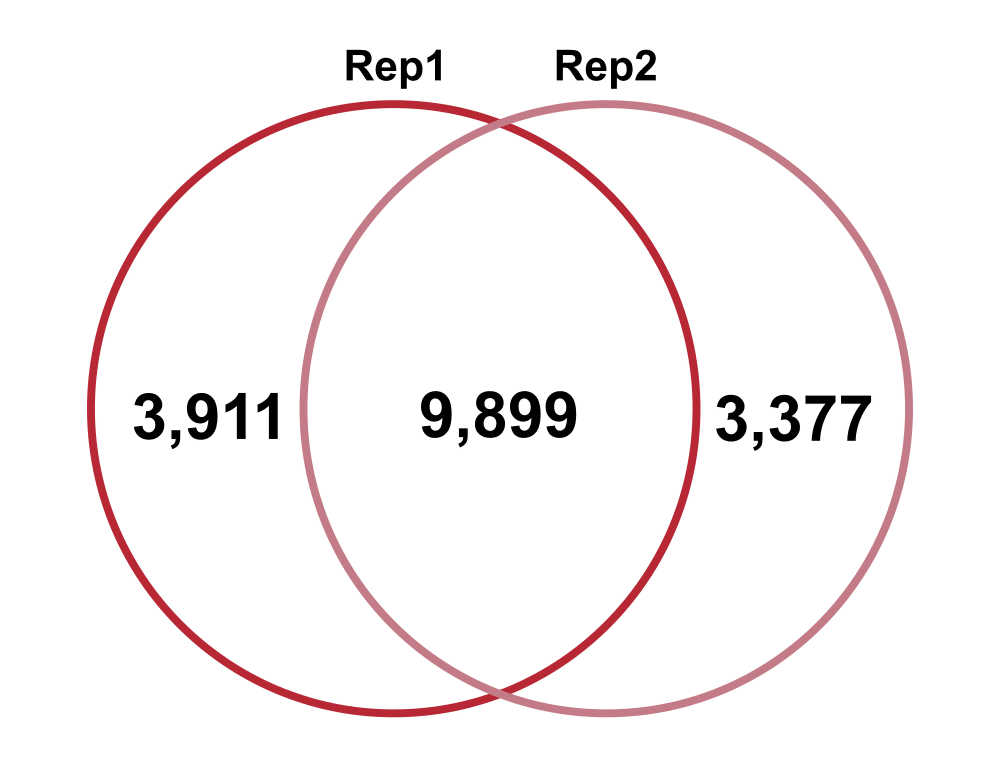
Jaccard: 0.58
Percent increase in clones: 24%
Technical Replicates – comparing Technical Replicate 1 (Rep1) and Technical Replicate 2 (Rep2) from Biological Replicate 2.
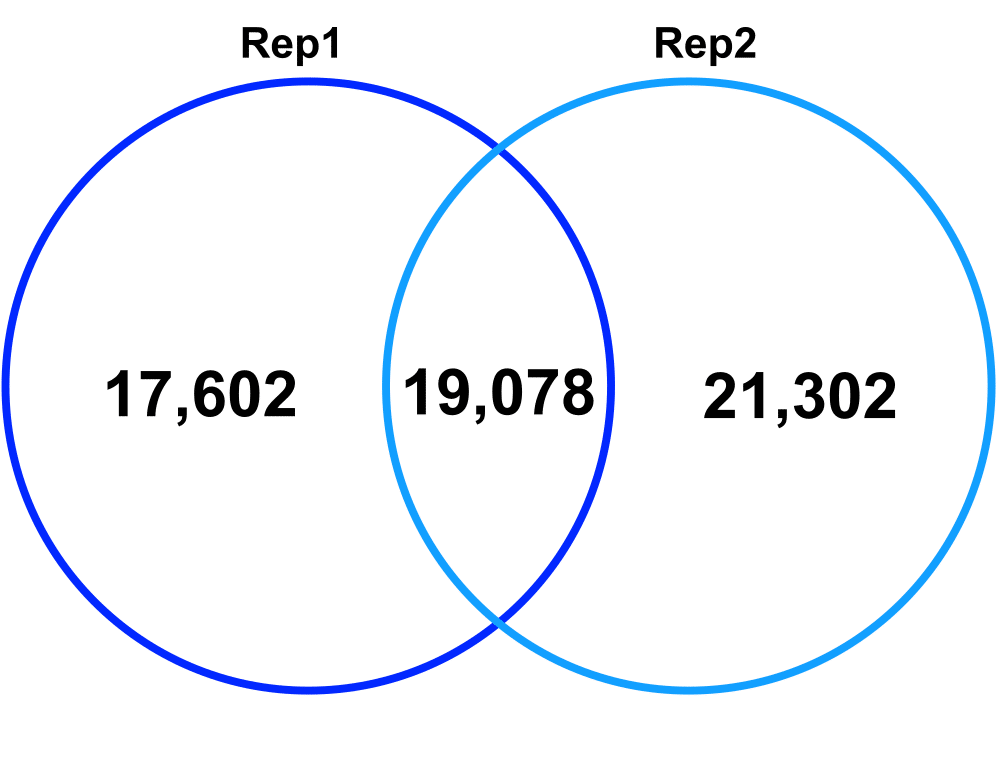
Jaccard: 0.33
Percent increase in clones: 58%
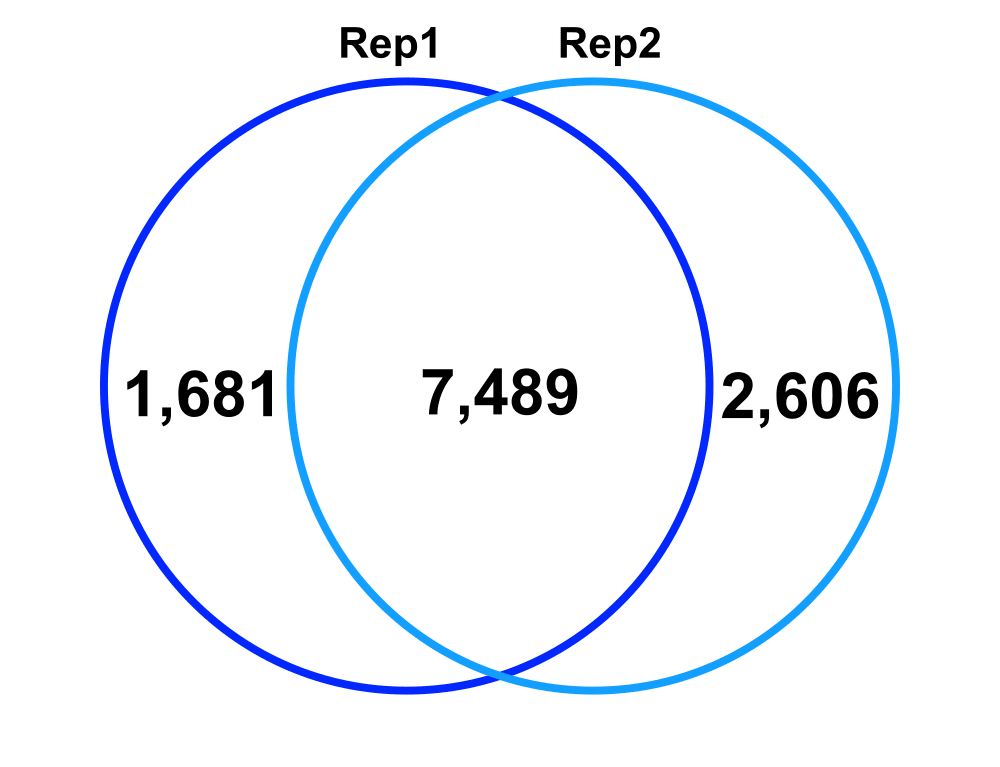
Jaccard: 0.64
Percent increase in clones: 28%
Biological Replicates – comparing Biological Replicate 1 (Rep1) and Replicate 2 (Rep2). The Technical replicates were merged for each biological replicate.
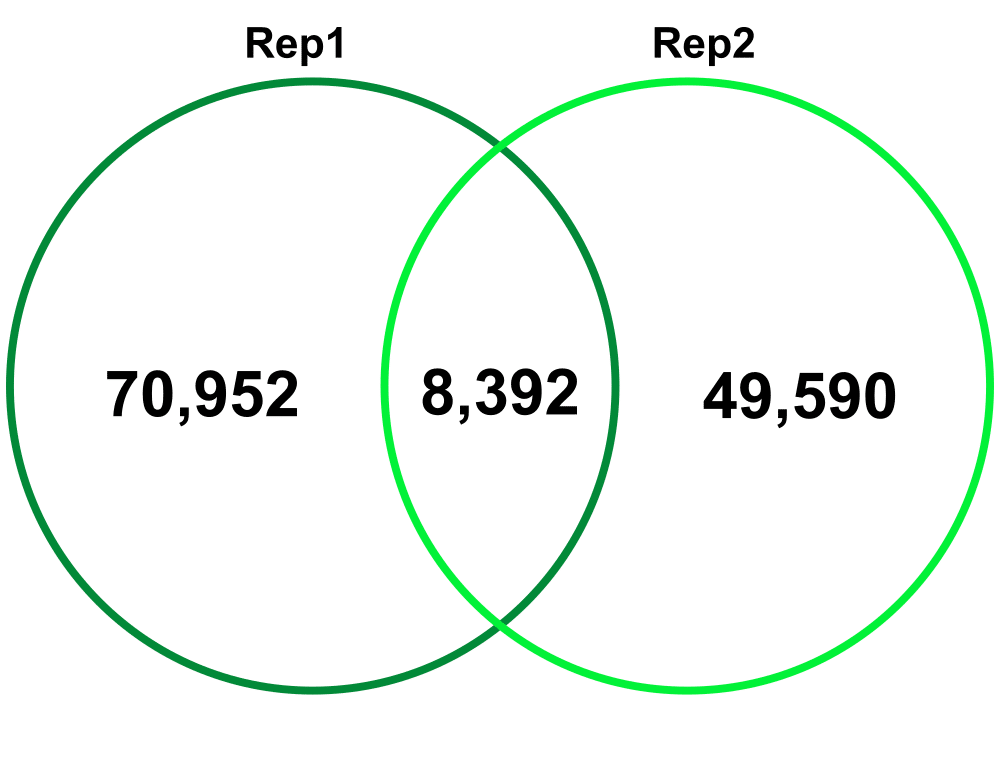
Jaccard: 0.07
Percent increase in clones: 63%
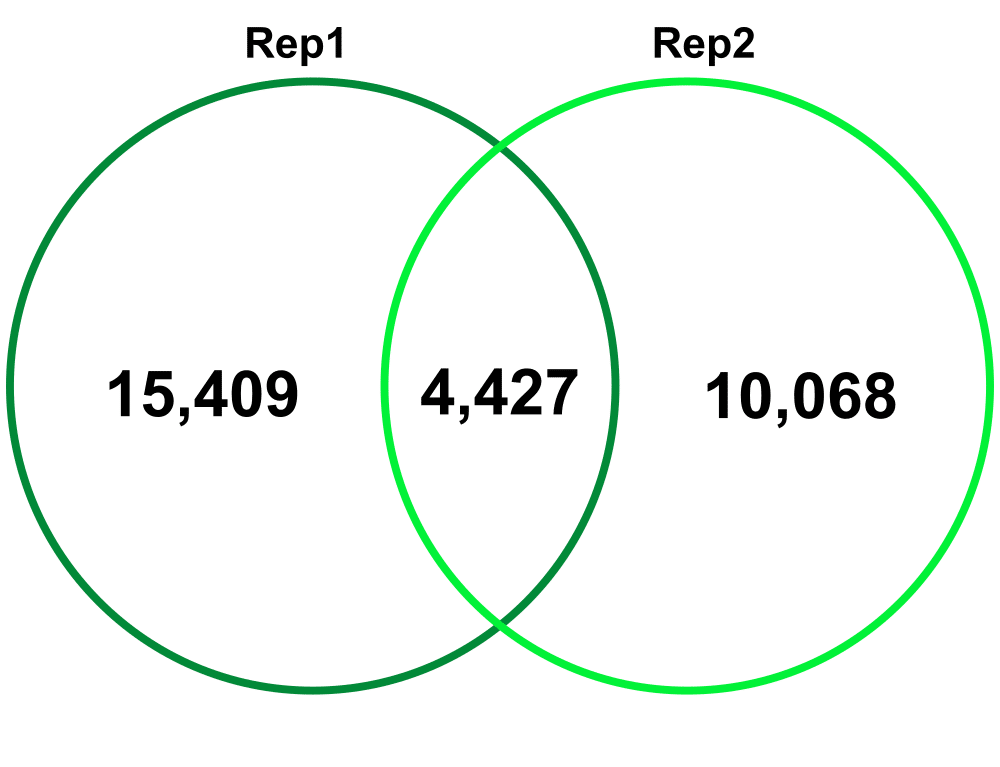
Jaccard: 0.15
Percent increase in clones: 51%
Take home message:
-
From high diversity samples, like PBMCs biological replicates (e.g sampling multiple aliquots of cells) provides important insight into total diversity, including among the most abundant clones.
-
Technical replicates have the most value when looking at total diversity, adding 58%-59% more clones for a sample.
Scenario 3: Antigen-sorted, single B cells from rabbit spleen
Project description: Splenocytes from a hyperimmunized rabbit were processed into single cell suspensions. IgG+ Antigen+ B cells were enriched and then split into two biological replicates. Each replicate contained an estimated 10,000 cells. Each replicate was lysed, RNA was extracted, and cDNA was synthesized. Transcriptome wide cDNA amplification was performed for 8 PCR cycles, and the sample was split into two technical replicates for each biological replicate. Each replicate was amplified using rabbit variable region-specific primers and analyzed by Reptor. We expect this repertoire to be very diverse since we are sampling the class-switched memory B cell population, but of limited size (< 10,000 sequences).
Clone sharing across the four libraries is shown in the table below. The diagonal contains the clones identified in each library, the upper right triangle contains the number of clones in the intersection between the two libraries over the number of clones in the union, and the lower left triangle shows the Jaccard index.
The number of clones identified per replicate is highly consistent with 4,844-6,194 clones per library. The technical replicates show the highest overlap (Jaccard index of 0.46) while libraries compared across biological replicates have consistently low overlap (Jaccard index of 0.03). Since the estimated diversity of the libraries should match the number of input cells (~10,000), combining technical replicates is needed to get close to this target diversity (6,852 clones for biological replicate 1, and 8,319 for biological replicate 2).
When looking at the top 25% of clones in each replicate, the technical have very high overlap (Jaccard index of 0.65 – 0.72). Across biological replicates, sharing is very low (Jaccard index of 0.05-0.06)
Take home message:
-
Biological replicates, even of low cell count samples can provide significantly more information for a project, particularly for high diversity samples like antigen-sorted, memory B cells.
-
Technical replicates of these samples are useful for recovering more sequences from a sample. For identifying abundant clones within low cell input samples, technical replicates provide additional corroboration but do not identify many new abundant clones.
Conclusion
-
Biological replicates of a sample provided significant benefits for obtaining more sequences overall.
-
Technical replicates of a sample can provide between 34%-58% more clones than a single replicate alone, even for low cell count inputs.
Related Posts
VHH Antibody Repertoire to Phage Library Comparison
Project Summary Camelids such as llamas and alpacas produce conventional antibodies as well as heavy-chain only antibodies (HCAbs) from which the small, stable antigen-binding domain (VHH) can be extracted. Abterra Biosciences developed Reptor, a proprietary antibody...
New Service: Alicanto for Antibody Discovery from Human Serum
We recently had the pleasure of attending the PEGS Boston Conference. We had the privilege of showcasing our work through a poster presentation, a talk, and an exhibit booth. Among the highlights were engaging with experts, exchanging ideas, and strengthening our...
Case Study: Reptor Phage Enrichment
Project Summary Phage display is a powerful toolkit for antibody discovery and engineering. In this study, we used phage display to identify Cas9-binding single domain (VHH) antibodies. In addition to traditional colony picking, we used our Reptor immune repertoire...
Get In Touch
