Multi-Species Antibody Repertoire Comparison
A decade ago, in vivo antibody discovery relied heavily on wild-type mice. Today, it’s not uncommon to generate antibodies using a petting zoo of animals including chicken, goat, rabbit, llamas, alpacas, and humanized rodents. The immune responses of these animals vary widely and new tools for antibody repertoire analysis show us just how different (and similar) they really are.
At Abterra Biosciences, we use our Reptor’s antibody repertoire analysis workflow to visualize antibodies from both naive and immunized animals. In this blog post, we highlight key differences between human, mouse, rabbit and llama.
Data Description
Antibody repertoire analysis across species is challenging due to differences in sample preparation and sources. For this blog post, we are only focusing on the heavy chains of IgG isotype antibodies. Below is an inventory of the samples compared:
Mouse (CD1)
-
mm-spleen: Taken from the spleen of 2 immunized mice at the end of an immunization campaign.
Rabbit (New Zealand White)
- oc-pbmc: Taken from the PBMCs of a single immunized rabbit early in an immunization campaign.
- oc-bm: Taken from the bone marrow of a single rabbit at the end of an immunization campaign.
Llama
-
lg-naive-g2: Taken from the PBMCs of a single, non-immunized llama and containing only IgG2/long hinge antibodies (one of the heavy chain-only isotypes).
-
lg-naive-g3: Taken from the PBMCs of a single, non-immunized llama and containing only IgG3/short hinge antibodies (one of the heavy chain-only isotypes).
Human
-
hs-naive: PBMCs were taken from a random human blood donor.
All samples were sequenced to a read depth of about 1M reads from the same amount of starting RNA. There is considerable heterogeneity to be expected from the samples in terms of B cell percentage in the underlying cell population. We previously described human repertoires across isotype and the repertoire of an immunized llama.
CDR3 Length
Since the CDR3 length distribution is virtually identical within the species described above, only one representative is shown in the CDR3 length distribution plot below. Here we show the frequency of CDR3 length (in amino acids) across the species.
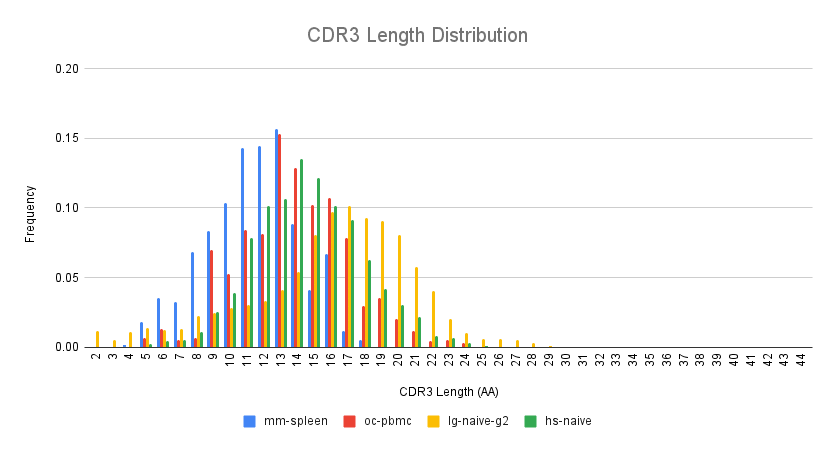
Median CDR3 lengths differ across the species:
-
mouse: 11 amino acids
-
rabbit: 13 amino acids
-
llama: 16-17 amino acids
-
human: 14 amino acids
Mutation Histogram
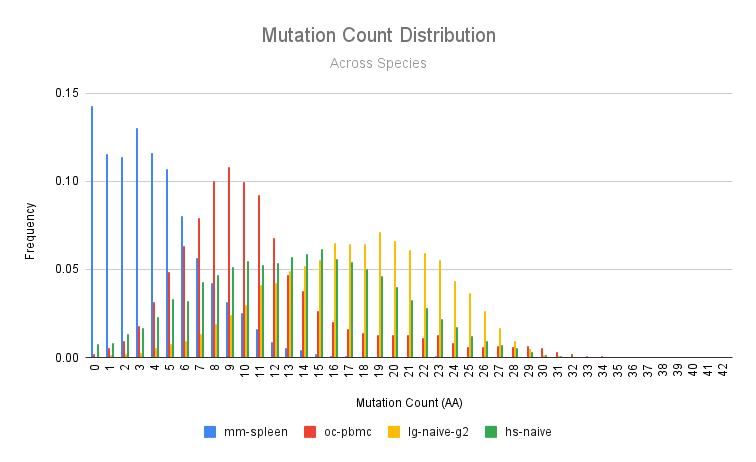
Mutations accrue in antibodies as a result of affinity maturation. Mutation count may be influenced by many factors outside of species, including sample source (e.g. PBMC vs. spleen) and context (e.g. naive vs immunized). Below, we show a mutation count histogram (amino acid mutations) across the species. The mutation distribution varies widely. The mouse sample has comparatively fewer mutations than the rabbit, who in turn has fewer mutations than the human and the llama.
We can perform a similar analysis by looking at the two species for which we have two samples: the rabbit (earlyPBMCs vs immunized bone marrow) and llama (naive PBMCs IgG2 vs naive PBMCs IgG3).
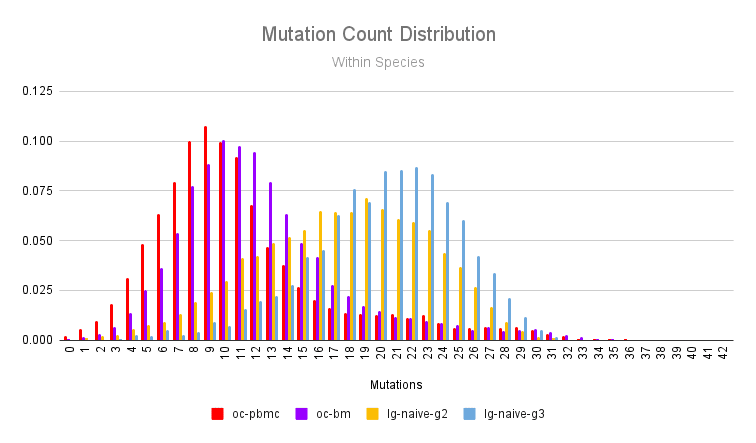
As expected, the rabbit bone marrow repertoire being both a site of plasma cells and taken after immunization has a higher mutation load than the rabbit PBMCs taken early in the immunization. As we’ve shown previously in our llama immune repertoire profiling post, the IgG3 isotype antibodies tend to have more mutations than IgG2 antibodies.
Clone Size Distribution
We define a clone by CDR3 amino acid sequence, so the size of a clone is the number of distinct antibody sequences that share the exact same CDR3 sequence. The distribution of clone sizes is exponential with a large number of clones being very small (1-2 sequences) though the shape of the distribution is slightly different for each species.
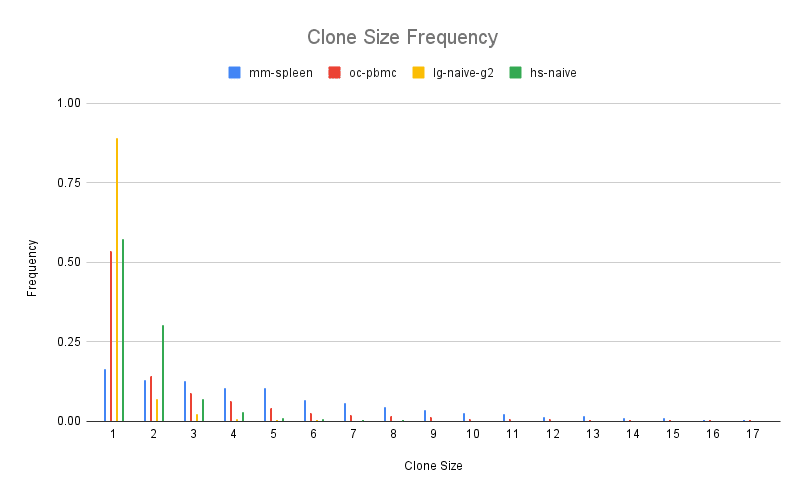
The mouse spleen shows the largest clones on average (6.95 sequences per clone) perhaps due to the tissue being a germinal center where B cells are undergoing affinity maturation. In contrast, the llama IgG2 repertoire is more diverse with smaller clone size on average (1.23 sequences per clone). Clone size measures how many unique sequences cluster based on identical CDR3. We can also look at how similar CDR3s cluster in the repertoire. We performed this clustering on each repertoire, retaining connections between CDR3s that are 90% identical or higher at the amino acid level. In this analysis, clusters of similar CDR3s form connected components in the network.
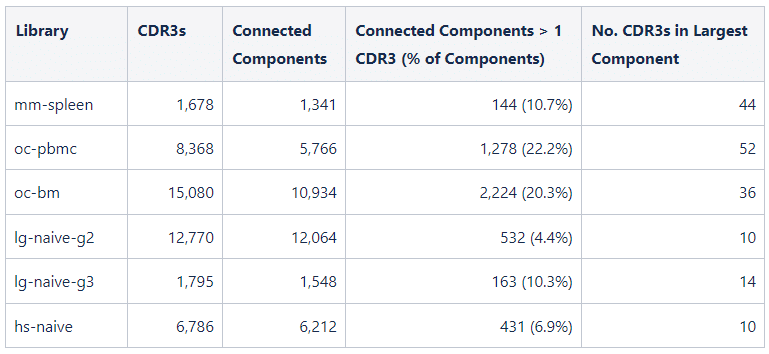
While rabbit clones are smaller on average than the observed mouse clones (3.23 sequences per clone in oc-pbmc and 2.01 sequences per clone in oc-bm), the CDR3s are more likely to be part of a cluster of related CDR3s. This may be an artifact of the shorter mouse CDR3s since 90% identity is impossible for CDR3s of length < 10. Compared to rabbit, llama clones are smaller on average (1.23 sequences per clone in lg-naive-g2 and 1.80 sequences per clone in lg-naive-g3) and less likely to part of a cluster of related CDR3s.
V-Gene Usage
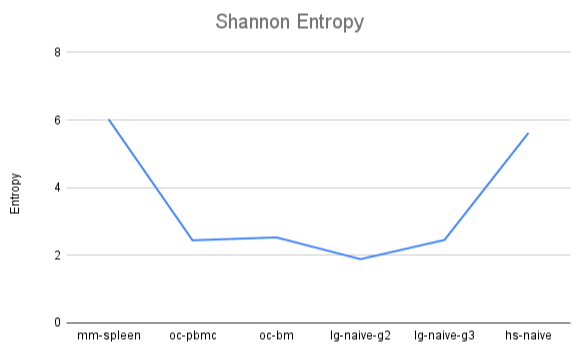
Our mouse and human datasets used a wider range of V genes than rabbit and llama.
All species have a collection of germline V, D, and J genes to select from when generating an antibody repertoire. While according to IMGT, human has a 57 functional V genes, rabbit has 39, mouse has 210, and llama (actually, alpaca) has 73. Individuals may show preferences for particular germline genes. In llamas, we also know that there is preferential use of certain V genes for single domain antibodies, which is what we are analyzing here. We analyzed V gene usage in terms of Shannon entropy. A repertoire that uses many V genes equally would have high entropy, while a repertoire that utilizes only a small number of V genes would have low entropy. This is a rough evaluation of V gene usage since it relies heavily on the number of V genes available and accurate V gene calling. Here we plot the entropy of the datasets analyzed in this blog post.
Conclusion
- The Reptor analysis workflow is able to analyze repertoires from a variety of species and conditions.
- Mouse, human, llama, and rabbit show significantly different distributions of mutations.
References:
[1] Lavinder, Jason J., et al. “Systematic characterization and comparative analysis of the rabbit immunoglobulin repertoire.” PloS one 9.6 (2014): e101322. (PubMed)
[2] Bonissone, Stefano R. “Immunoglobulin gene conversion identification and analysis.” bioRxiv (2019): 828434. (bioRxiv)
Get In Touch